


🧬 The DNA of decision intelligence products: Key characteristics you have to know
Decision intelligence products come in different shapes and flavors

Hello friends!
I hope you enjoyed last week’s introduction to the decision intelligence product ecosystem.
This time, I will take you on a journey to learn the key characteristics of decision intelligence products, or their " DNA.” Let’s dive right in!

🏁 Intro
As you know, digital products are not created equal, and we must consider many different parameters before designing and developing them.
Whether you’re a product manager, designer, software developer, data analyst, or business strategist, understanding the core characteristics of decision intelligence products is critical to ensuring their effectiveness.
Decision intelligence products do not fit into rigid categories. Instead, they exist along a spectrum of characteristics that define how data, information, and insights are structured, consumed, and applied in decision-making. By understanding these distinctions, product teams can design and develop products that truly support and enhance decision-making processes. After all, we’re in the business of helping humans make decisions.
🔍 Characteristics of Decision Intelligence Products
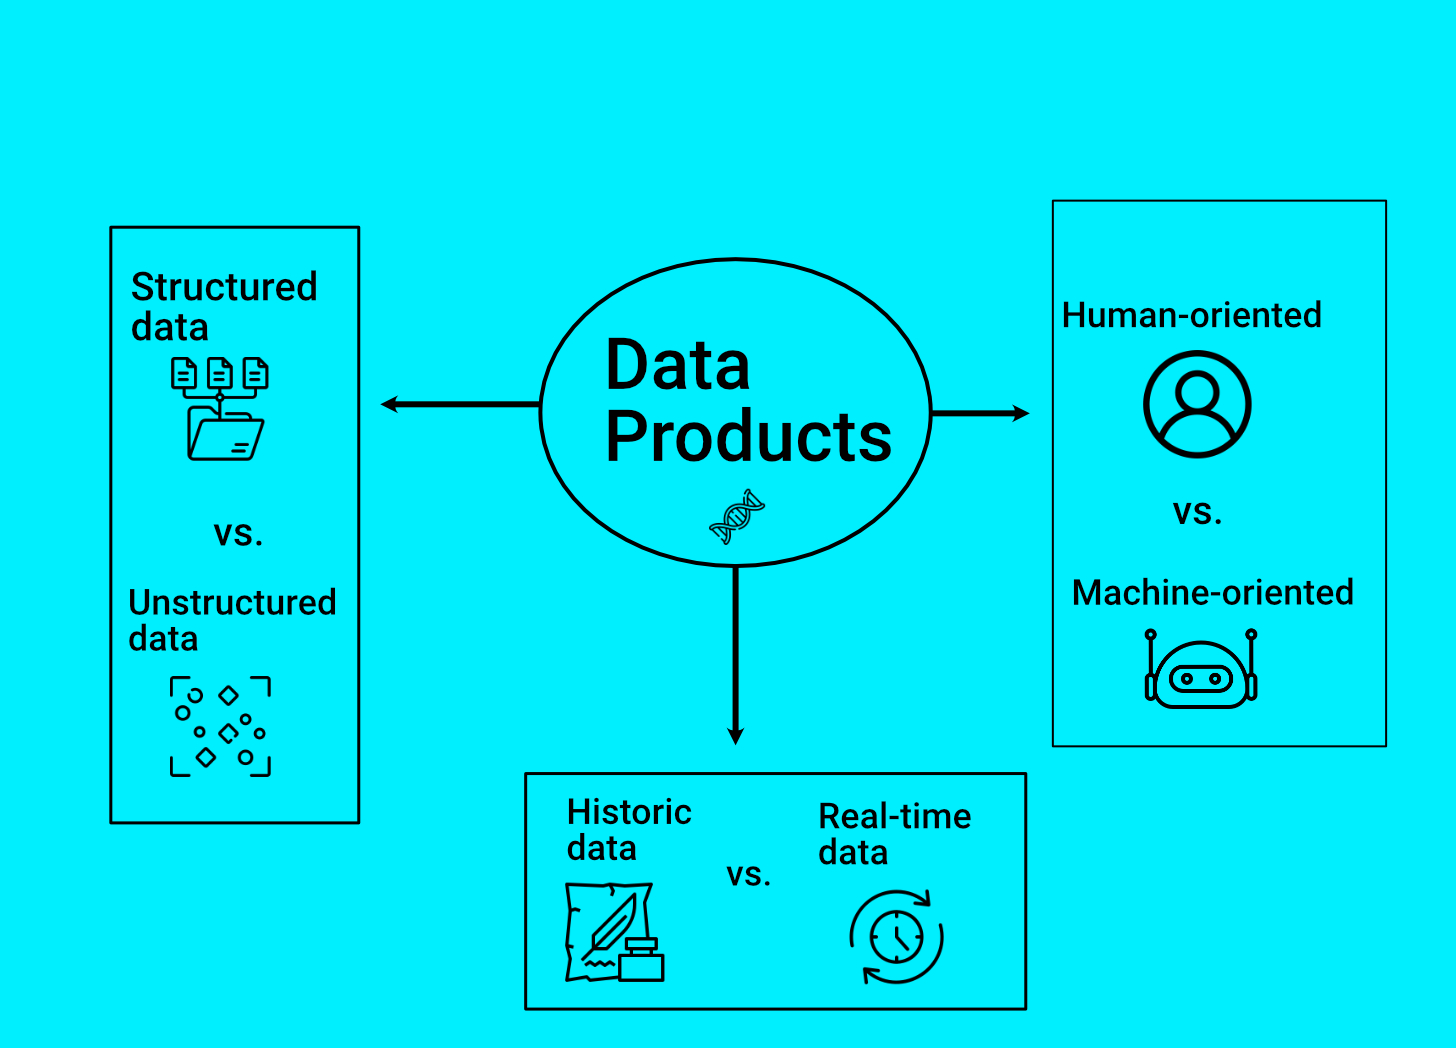
📊 1. Data Products: The Foundation of Decision Intelligence
Data products provide raw materials for decision-making while enabling the creation of data stories. Their effectiveness depends on how they are structured and accessed.
✅ Structured vs. Unstructured Data
Structured data: Organized in a predefined format. This could include databases, data schemas, and spreadsheets. Just think of rows and columns
Unstructured data: Raw, less organized data such as text logs, and audio transcripts
Example: A CRM database storing customer purchase history (structured data) vs. call center recordings that can be used for sentiment analysis (unstructured data, or more like unstructured complaints?).
✅ Historical vs. Real-Time Data
Historical: Provides records for trend analysis such as sales and financial transactions
Real-Time: Offers immediate insights for fast decision-making. For instance, live IoT sensor data, and real-time incidents in cybersecurity
Example: A financial firm using past stock data for trend analysis (historical) vs. a stock trading platform processing live market feeds (real-time).
✅ Human-Oriented vs. Machine-Oriented Data
Human-Oriented: Designed for visualization and interpretation. For example, interactive dashboards and analysis in MS Excel done by humans
Machine-Oriented: Optimized for system processing. For instance, APIs feeding AI models
Example: A website heatmap tool showing user clicks (human-oriented) vs. a fraud detection algorithm consuming raw transaction data (machine-oriented).
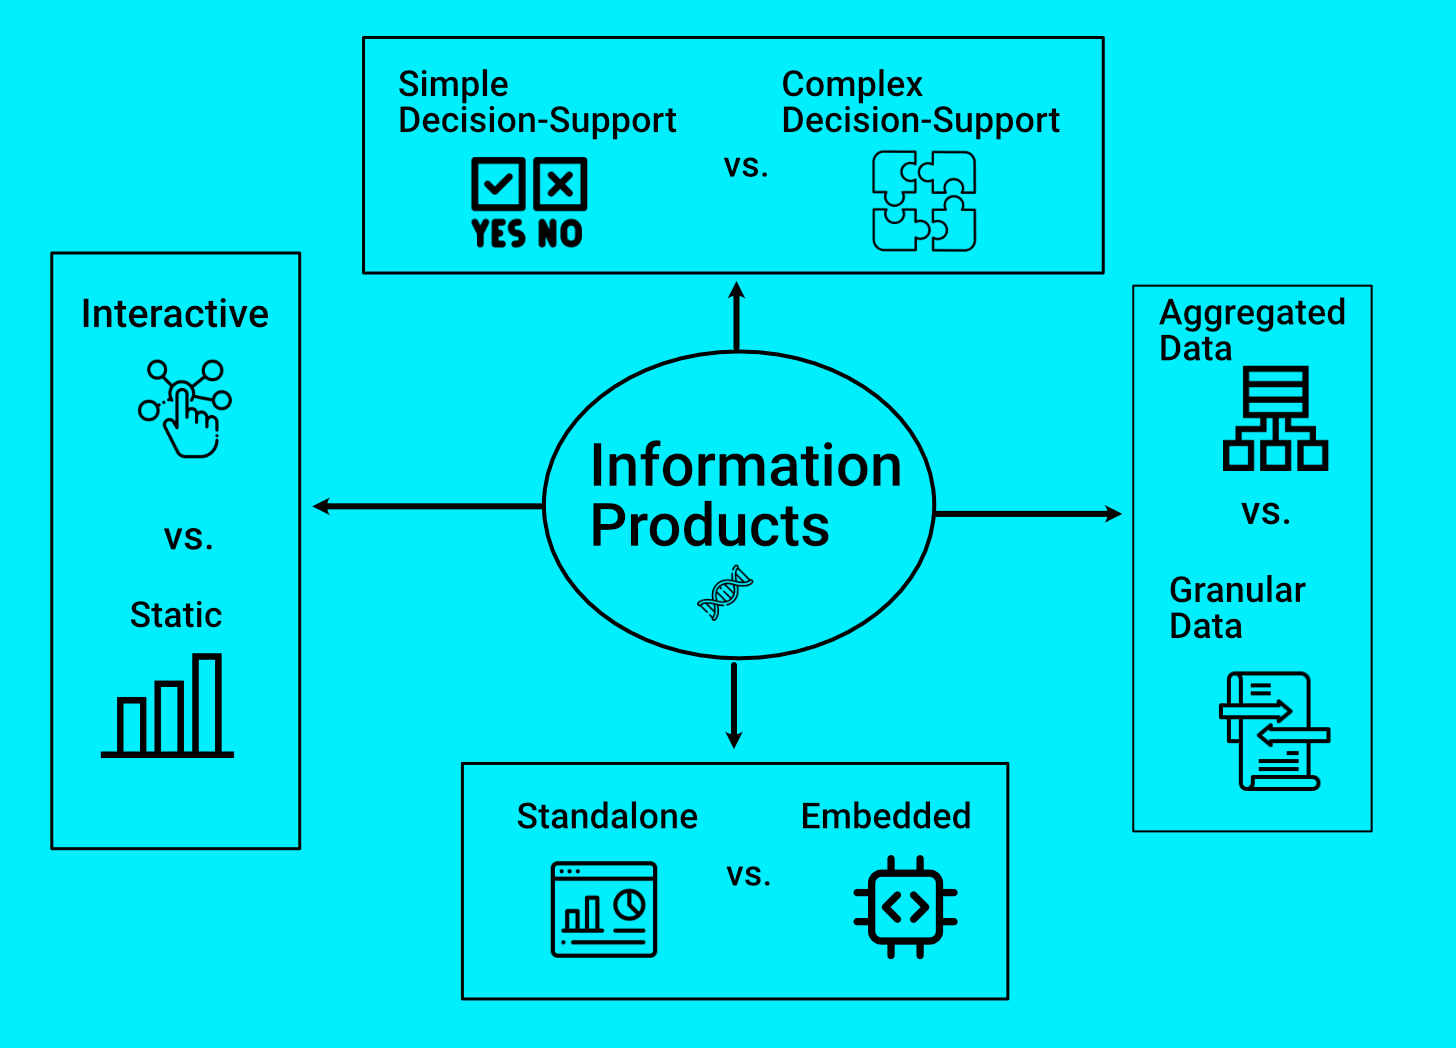
💻 2. Information Products: Structuring Data for Decision-Making
Information products transform raw data into digestible formats (think about transforming ideas into a coherent story). Their effectiveness depends on how they are presented and consumed.
✅ Interactive vs. Static Products
Interactive: A user can filter and play around with the information (e.g. an interactive dashboard)
Static: Data cannot be filtered or changed (e.g. static monthly reports, deep-dive industry reports)
Example: A real-time energy consumption tracker (interactive) vs. a monthly energy bill report (static).
✅ Embedded vs. Standalone Information products
Embedded: Integrated within another platform/solution. For example, a personal spending tracker within a mobile banking app
Standalone: Exists as a separate tool. For instance, Google Analytics, or any other standalone analytics tool
Example: A stock market dashboard within a broader trading app (embedded) vs. a standalone application that only tracks trends in the financial markets(standalone).
✅ Aggregated vs. Granular Information
Aggregated: Provides high-level summaries (e.g. executive dashboards)
Granular: Offers detailed breakdowns (e.g. transaction-level reports)
Example: A CEO dashboard summarizing company revenue (aggregated) vs. an analyst’s detailed report of every sale (granular).
✅ Simple vs. Complex Decision Support
Simple: Supports momentary, simple decisions (e.g., navigation apps, car dashboard)
Complex: Aids in deeper analysis and planning (e.g. enterprise BI tools)
Example: A GPS suggesting the fastest route (simple) vs. a supply chain planning tool forecasting risks (complex)
In addition, this category can be applied to insight products as well.
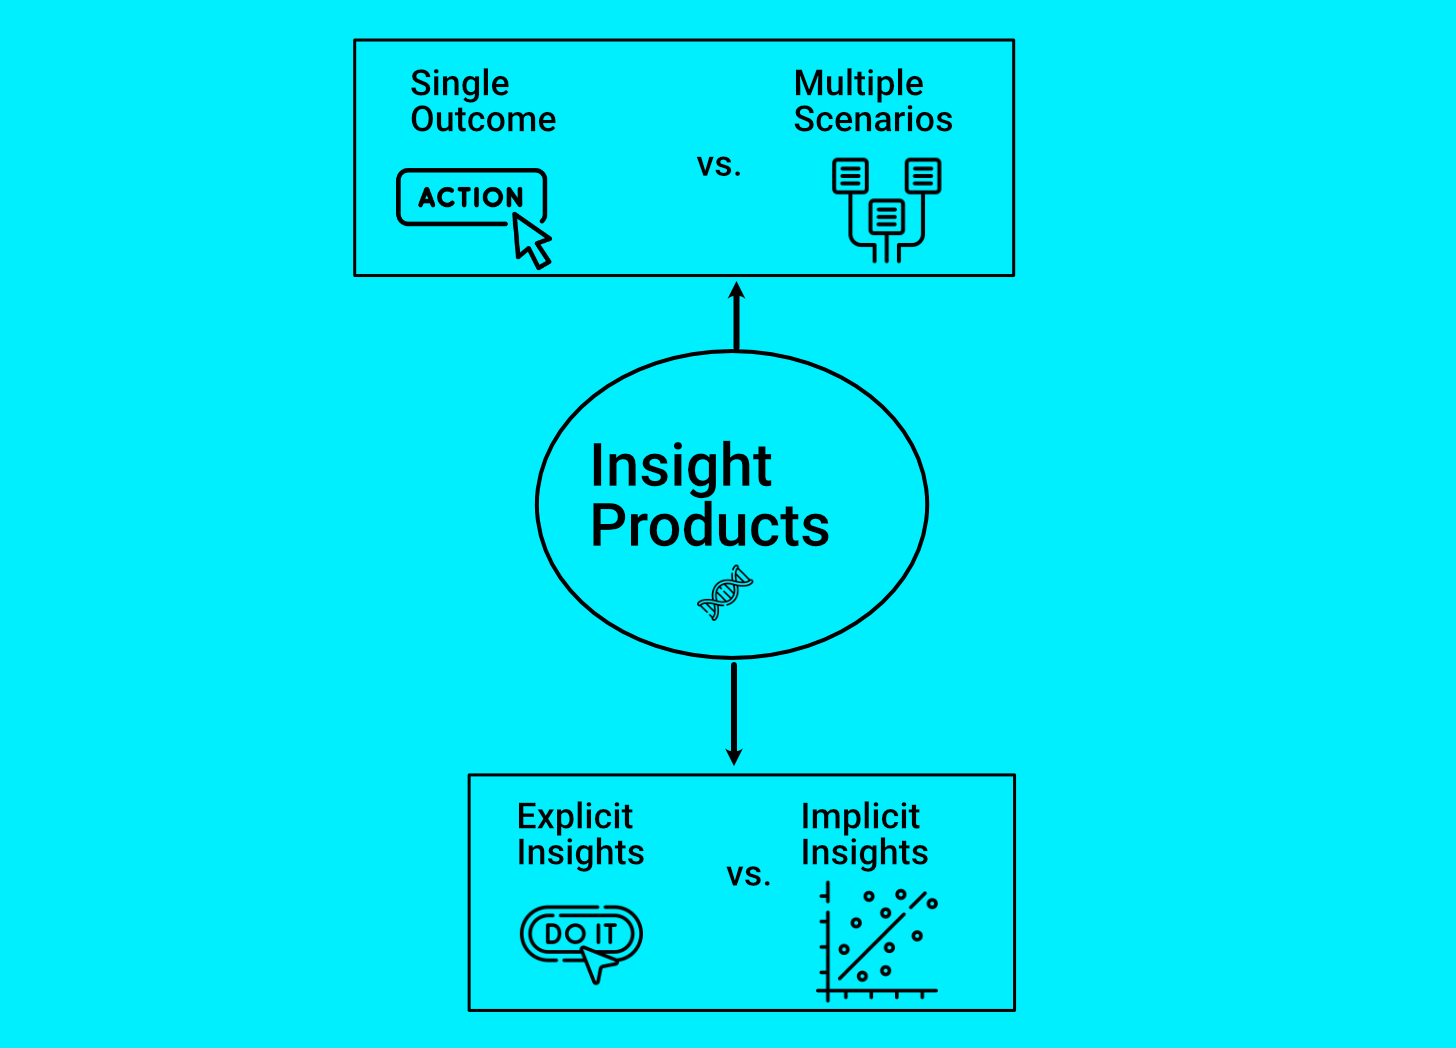
💡 3. Insight Products: Enabling Smarter Decisions
Insight products not only present information but also guide what actions to take. Their characteristics define how decision-making is supported.
✅ Single-Outcome vs. Multi-Scenario Insights
Single-Outcome: Provides one recommended action
Multi-Scenario: Presents various options for different potential outcomes
Example: A demand forecasting tool suggesting a single inventory level (single outcome) vs. a digital twin modeling different demand conditions (multi-scenario).
✅ Explicit vs. Implicit Insights
Explicit: Clearly states conclusions (e.g. “Reduce churn by improving support response time”)
Implicit: The solution can take you further in your analysis but still requires user interpretation (e.g. showing results of the K-means algorithm)
Example: A customer analytics tool that directly suggests retention strategies (explicit) vs. a visual dashboard showing clusters of similar types of customers without direct recommendations (implicit).
🎯 Conclusion
Decision intelligence products don’t usually fit into rigid categories. Instead, they exist along a spectrum of characteristics that influence how they process, present, and act on data. As a product team, selecting the right combination of characteristics is crucial in ensuring that your product truly empowers users to make better decisions.
When designing decision intelligence products, here are some questions to ask yourself:
➡️ Who’s the decision maker that will use this solution?
➡️ What kind of decisions do they need to make based on the information?
➡️ What’s the context of their use? (e.g. on the fly, while sitting in an office, etc.)
By making conscious design choices based on these characteristics, you can create decision intelligence products that seamlessly integrate into workflows, enhance decision-making, and deliver real value to users.
In the next two articles, I’m planning to explore two topics:
I’ll reflect upon my participation in a consultation held for the UN Global Environmental Data Strategy (GEDS) and share a few thoughts about the lifecycle of decision intelligence products and lifecycle of data
I’ll explore some of the common personas that use information and insight products and help you understand why it is important to know these personas in advance so you can choose the right characteristics for the decision intelligence products you’ll create for them.
If you know anyone who works on decision intelligence products or is interested in this space, invite them to subscribe to Signal to Product at this link (signaltoproduct.substack.com) or share this post with them.
If a friend sent it to you and you’d like to learn more about this fascinating space of decision intelligence products subscribe for free to Signal to Product now to get my articles, case studies, and more directly to your inbox.
©Yaron Cohen - 2025
Amazing visuals. I was able to read the article from a text only and graphics only perspectives, and get the same clarity!
Thank you for another great article Yaron!